Now a days in many website we use chart to show the statistics for the site and there are many plugins and gems available for it. But I liked one gem Chartkick that I used in one of our application to create column chart to show weekly, yearly and From date - ToDate range statistics of site. I found it very useful and easy to use. You will get details about chartkick here.
To use chartkick you have to just follow simple step and you are ready to create beautiful Javascript charts with one line of Ruby.
Chartkick can work with Highcharts, Chart.js and Google charts to create dynamic and interactive charts that draw data from the Rails application. And the best part, you just need to write one single line of Ruby code. Isn’t that amazing and powerful!
-
Let’s begin with Installation:
In gem file, add:gem chartkick -
In application.js, add:
//= require chartkick
Note: In the instructions below, application.js must be included before the helper methods in your views, unless using the :content_for option.
-
In your views, before application.js, add:
<%= javascript_include_tag "https://www.gstatic.com/charts/loader.js" %>
Now, You are ready to create chart. Only add one line of ruby code to generate chart of any type for example pie chart, line chart, area chart, column chart and many more. For example.
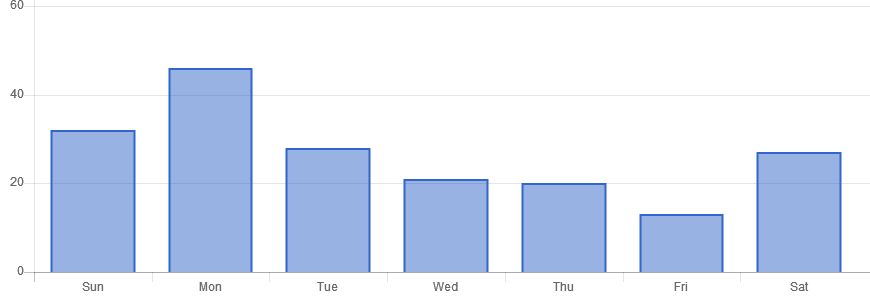
<%= column_chart Order.group_by_week(:created_at, format: "%a").count %>
In the above example, I have just shown you how we can make a column chart. Similarly you can create other charts.
Here group_by_week is the method from Groupdate. You need to install Group date gem to use this method. Using groupdate you can group by:
- second
- minute
- hour
- day
- week
- year
You will get more information about Groupdate here.
Now, let’s have some real fun by using Chartkick to create some interactive Graphs, using Dynamic data.
To create a graph which drives data from the ajax request, you just need to define a method in the controller and pass the JSON data. For example
app/controllers/views_controller.rb:
class ViewsController < ApplicationController
   def show
      @view = View.all
  end

  def views_by_day
    render json: View.group_by_day(:viewed_at, format: "%a").count
 end
end
Next, add in the code listed below to your views/show view.
app/views/views/show.html.haml:
.container
  .h3 Views By Day
  = column_chart views_by_day_view_path
There you have it how you want.