
As software developer most important thing for us is to understand debugging. When things go wrong with code, we need to be able to find the bug quickly and solve it. Today we are going to have look at some important thing regarding ember app debugging. These are small things but can help you if you are new with ember and trying to debug some error in your ember application.
Ember Inspector:
It is a browser extension available for Chrome and Firefox. This is helpful tool for debugging ember app. You can simply add it from webstore. You will see new optionEmber in browsers developer tools.
Click on Ember option and it looks like this:
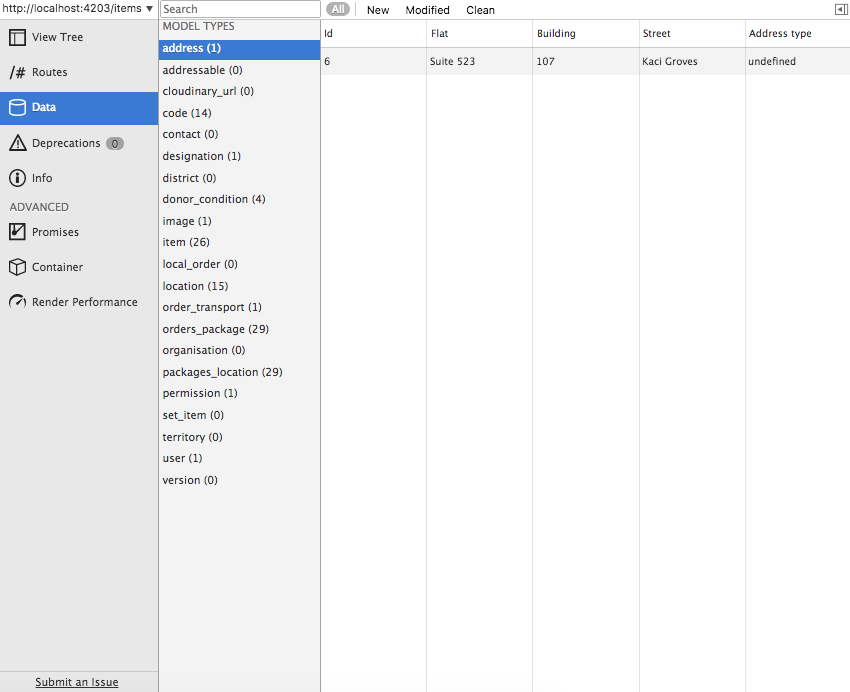
lets have look at ember inspector important options in short :
Info: This shows ember version details of application.Routes: It shows list of routes in application. If you click onCurrent Route onlycheckbox then it will only shows routes currently used.Data: It shows all models from app and also records loaded for those models.Render Performance: This is an important option and it shows rendering time in mili seconds.container: It shows list of controllers, template, routes etc.
In detail check here Ember Inspector
Now lets have at look at how we can debug things in ember.
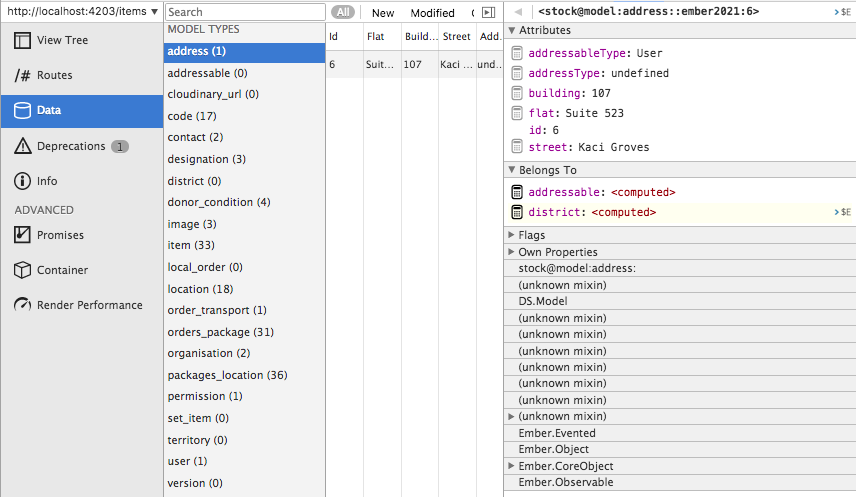
- Whatever we use in ember app is first gets loaded to data thus we can check all data is properly loaded into
datasection or not. By clicking on any record it shows all attribute and its relationship details.
- Check network tab to verify response of your request is proper or not. Also we can check data in response is proper or not. Its common for web developer to see network tab.
- Ember uses MVC pattern thus its necessary to consider routes, controller and model flow for debugging. You can open any file from mvc in source tab of devtools like an normal javascript file and put break point for further debugging.
- If you are accessing model data from from console then it will return you an object and you can see actual data in object -> Internal model -> data.
- In ember inspector if you click on routes or controllers then it has
$Eoption besides it. Fastest way to access the store object is by accessing any route or controller object.We can list the objects inside container, click on any controller and then click on the >$E symbol . By using this we can get access to store and perform store operations. Handlebaris most commonly used in ember apps and its really tricky to find a way to debug templates written in handlebars if you are not aware of{{debugger}}and{{log}}helper. {{debugger}} helper works same as breakpoint and normal js debugger but if you want to check suppose particular computed property then you need to typeget('property_name').{{log}}do not work like breakpoint. It simply prints output on web console. e.g{{log isAvailable}}
This is small info to start with ember debugging and then if you are aware of these small things then you can debug further in details. Hope this helps. Thanks.